.svg)
Enable pay equity analytics
with ease
Analyze pay gaps and visualize gender insights to stay compliant
with EU Pay Transparency directives
Building pay equity reporting should not be a burden
Complex processes or spreadsheet-based reporting make it difficult to highlight crucial insights.
That makes it difficult to keep up with evolving EU pay transparency rules and to answer tough questions from employees and leadership.
A dedicated module in Heyquity turns this into a recurring process instead of a yearly burden.
Everything you need for pay equity and transparency
Monitor pay gaps, run compliant reports, and turn complex data into clear, actionable insights for HR, Finance, and leaders.
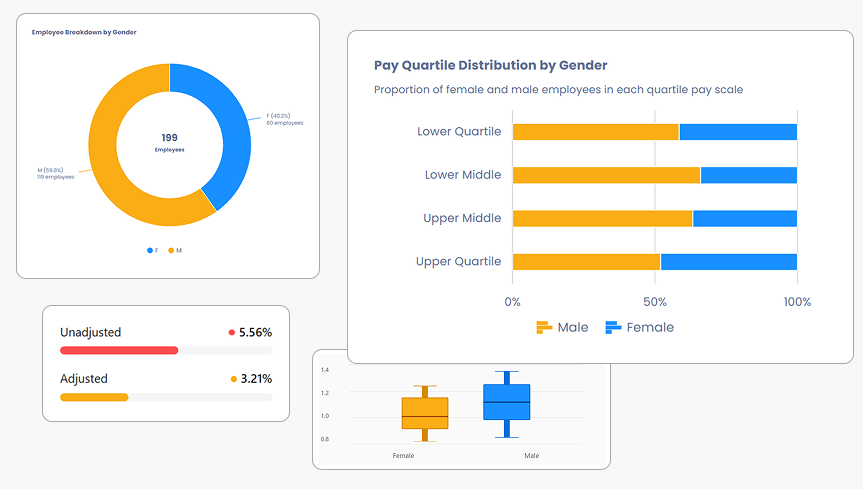
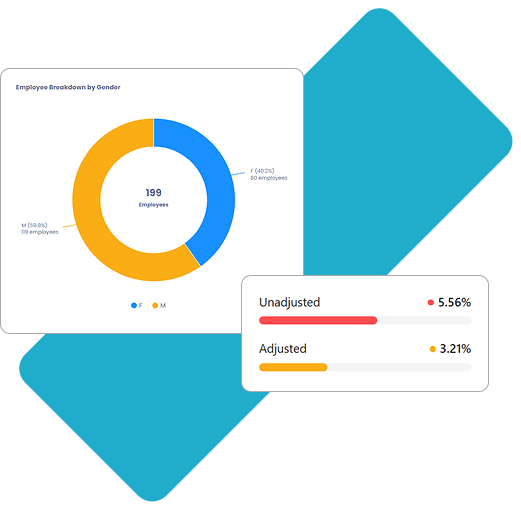
Automated pay equity snapshots
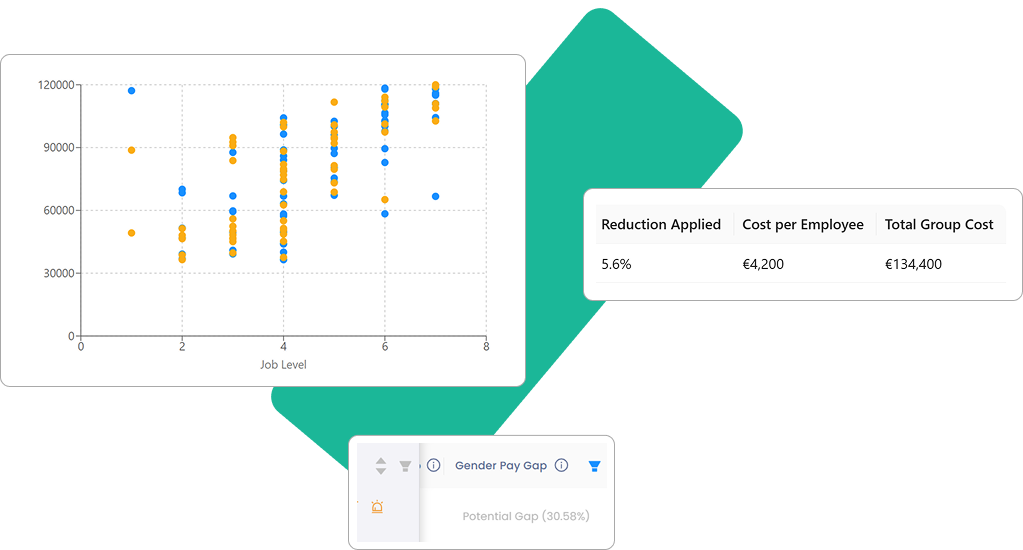
Run recurring analyses by gender and other dimensions. Compare pay by peer group, level, location, or other fields with clear visualizations.
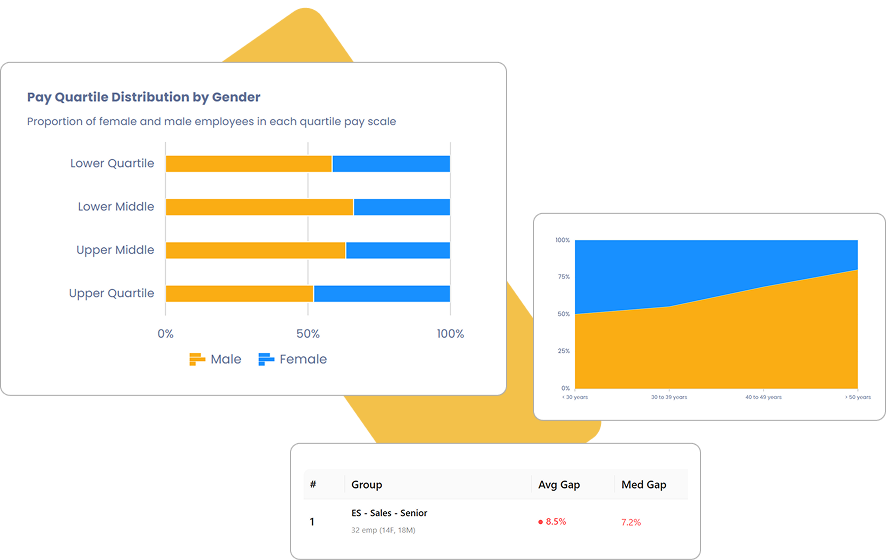
EU pay transparency reporting
Generate metrics aligned with upcoming EU requirements (average & median pay gaps, quartile distributions, comparisons between peer groups). Export data and charts you can share with works councils, regulators, or leadership.
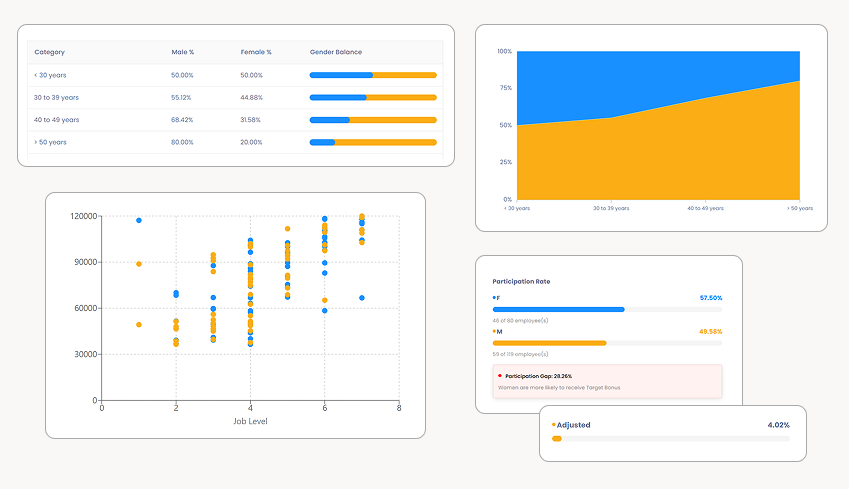
Gap diagnosis & remediation planning
Identify unexplained gaps at the team or individual level. Project adjustment scenarios and estimate cost impact before making changes.
Compensation Insights
 Pay Communication Guide: How to Build Trust During Compensation Reviews
 Pay Equity Analysis: Assessing and Closing Pay Gaps
 Merit Matrix Guide: How to Structure Fair Compensation Increases
Integrated with your HRIS
Sync employee data from your HRIS platform to keep compensation reviews, pay equity, and rewards up to date.


.svg)
